
Deep Dive: Statistical Analysis of Elo Progression Over a Chess Career
Understanding how a chess player’s Elo rating evolves over time can provide valuable insights into training efficiency, skill development, and realistic goal-setting. This article takes a deeper look at how statistical methods can help you analyze and predict your Elo trajectory, whether you’re a club player aiming for 1800 or an ambitious competitor targeting 2200+.
Why Analyze Elo Progression?
- Identify Training Gaps: By breaking down your rating changes over specific intervals, you can see when you made the most progress and correlate it with the study methods or tournament schedules that worked best.
- Set Realistic Goals: Looking at average growth rates helps avoid unrealistic expectations—knowing a typical progression curve keeps motivation in check.
- Pinpoint Plateau Patterns: Statistical dips or flatlines in rating growth often correspond to skill plateaus, which can be addressed with targeted training.
Data Collection Methods
To conduct a proper analysis, start by gathering data points from a consistent source:
- Tournament Reports
- FIDE/USCF rating updates after each sanctioned event
- Platform-specific ratings (Chess.com, Lichess) if you compete online
- Training Logs
- Track the hours spent on tactics, endgames, and opening prep
- Note changes in your study routine or coaching schedule
- External Factors
- Life events, such as academic or work commitments, that might affect your focus
- Health or psychological aspects influencing your performance
Collect these data points in a spreadsheet, noting your rating, time period, and any relevant factors that could explain fluctuations.
Basic Statistical Tools
1. Moving Average
A moving average smooths out short-term fluctuations and highlights longer-term trends. For instance, you could compute a 3-month moving average of your Elo to see how your rating has evolved despite temporary spikes or drops.
2. Standard Deviation
Standard deviation indicates how spread out your results are. If you have a high standard deviation in rating changes, it means your performance is more volatile—possibly due to inconsistent training or irregular tournament schedules.
3. Correlation Analysis
If you record time spent on tactics training or opening prep, correlation analysis can help you see if more practice directly relates to rating gains. While correlation isn’t causation, strong relationships can guide your study focus.
Identifying Patterns and Plateaus
- Early Rapid Growth
- Beginners and developing players often see large rating increases in a short time, simply by learning basic strategic and tactical motifs.
- Mid-Level Plateaus
- Many players hit a plateau around 1500–1800 Elo. Specialized or guided training becomes essential to break through.
- Slow Incremental Gains
- Beyond 2000 Elo, consistent growth usually slows down. Gaining 100 rating points at this level can take months or even years.
- Statistical Outliers
- Sudden spikes might correspond to a few strong tournament performances or an intense study period. Sudden drops could relate to a lack of practice or psychological factors.
Predictive Modeling
Linear Regression
A simple linear regression model can help forecast your Elo progression if you assume a steady rate of improvement over time. However, linear models might not accurately reflect plateaus or other non-linear growth patterns.
Logistic or Polynomial Models
Advanced statistical or machine-learning approaches can model the diminishing returns typically seen as your rating climbs. These models may better predict plateau points and potential breakthroughs when new training methods are introduced.
Practical Tips for Improving Your Statistical Analysis
- Regular Data Entries
- Update your spreadsheet or tracking tool after each tournament.
- Include key performance indicators (KPIs) like accuracy in tactical puzzles or endgame performance.
- Visualize Progress
- Use line charts or scatter plots to identify patterns more intuitively.
- Segment your data by type of competition (e.g., classical vs. rapid).
- Consult a Coach
- A seasoned chess coach familiar with statistical methods can interpret your data and prescribe targeted training.
- Compare Against Peer Groups
- Benchmark your rating gains against players of similar levels to see if your progress stands out or aligns with common trends.
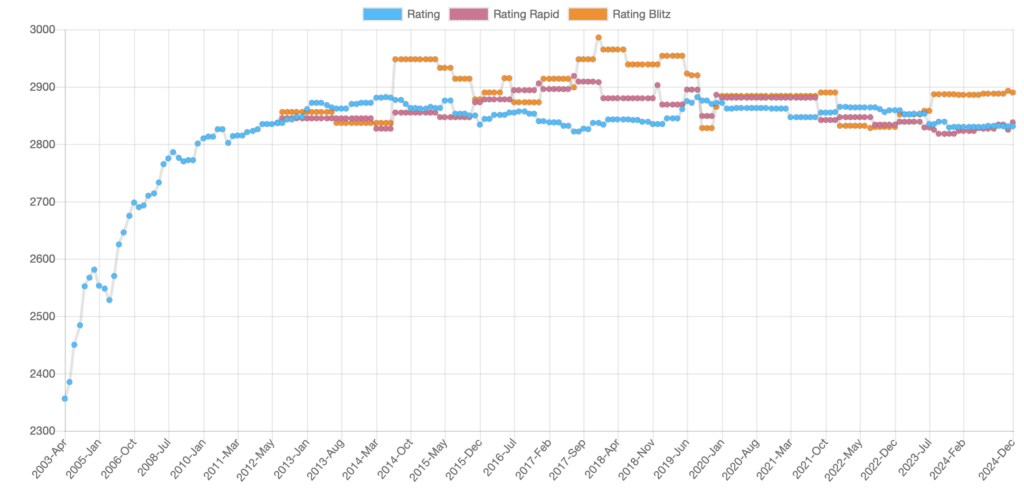
Case Study: Sample Rating Curve
Imagine you have data spanning two years:
- In the first six months, you climbed from 1200 to 1500 Elo—rapid progress often seen when players systematically address basic tactical weaknesses.
- Over the next year, you reached 1700. Growth slowed, and you had a 3-month plateau around 1650.
- Introducing a new endgame practice regimen correlated with a subsequent 50-point boost.
By plotting your rating progression, the plateau and subsequent jump become visually striking. This kind of granular analysis can guide strategic adjustments in your study routine.
Final Thoughts
Statistical analysis doesn’t replace dedicated chess study, but it can significantly enhance your approach by quantifying trends, spotting plateaus, and evaluating which training methods yield the best returns. A methodical review of Elo progression offers clarity on how to break barriers and continually evolve as a chess player.
Make the numbers work for you—collect data, analyze trends, and transform insights into actionable improvements. With consistent tracking and a willingness to adapt, you can manage your Elo growth more effectively and reach your next rating milestone.
Leave a Reply